MSP profit margins: 2026 benchmarks and what actually moves the needle
TL;DR
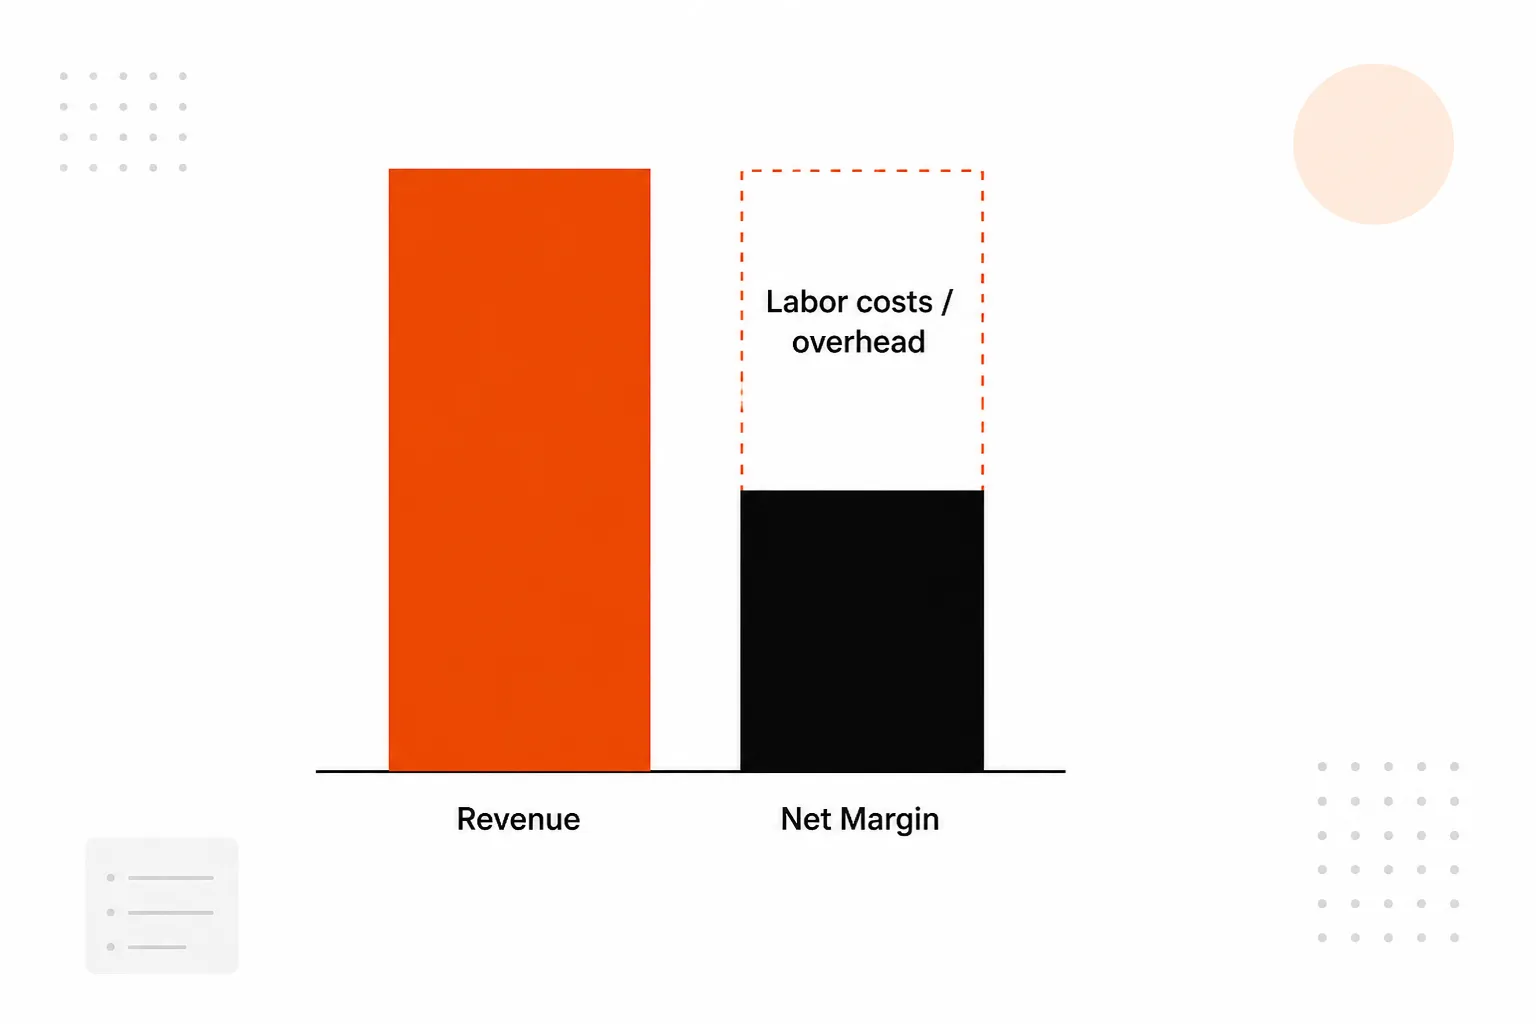
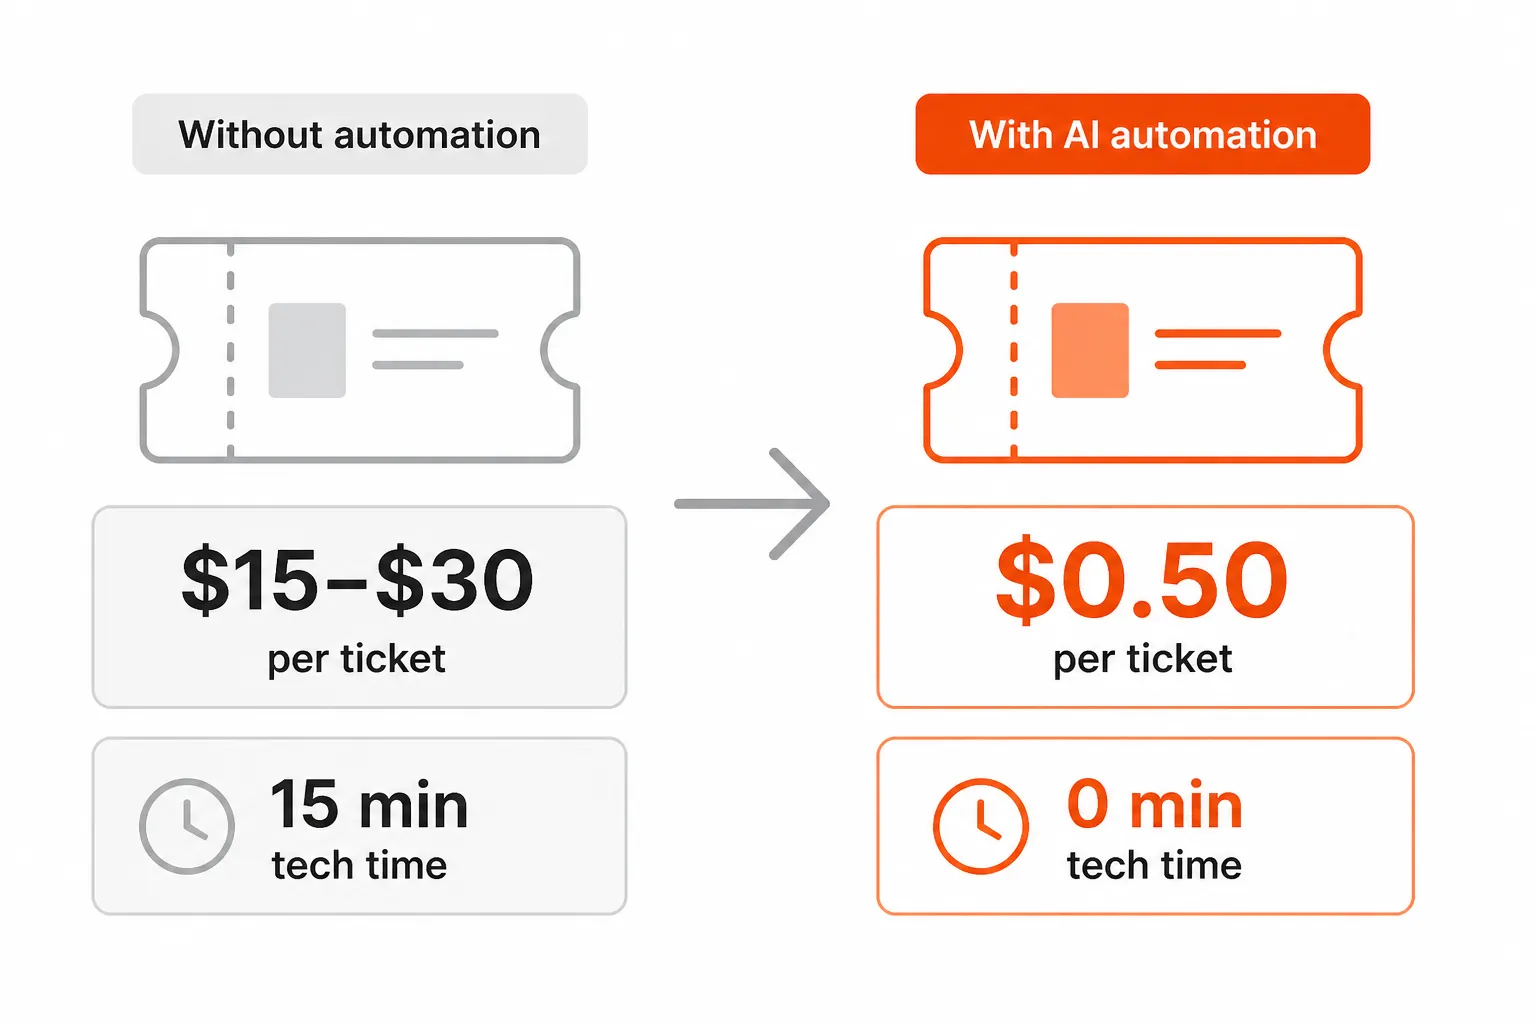
The average U.S. MSP runs at 14–17% net margin in 2026. Healthy is 20–30%. Top performers hit 35%+. The gap isn't usually a pricing problem - it's a labor utilization problem. L1 tickets are the main silent margin killer: most shops burn $15–$30 per ticket in technician time on work that can be automated for $0.50. If you're under 20% net margin, the fastest path to improvement is measuring your actual cost per ticket and addressing what's eating your techs' time before renegotiating a single contract. Tyqra automates L1 ticket resolution at $0.50/ticket with no implementation cost, recovering $7K–$15K/month in tech labor for the average MSP.
What the benchmarks actually say
The Kaseya 2024 MSP Benchmark Survey is probably the most cited industry data source, and the Service Leadership Index fills in the gaps at the high end. Here's what they say:
| Metric | Benchmark |
|---|---|
| Gross profit margin (healthy target) | 50–60% |
| Gross margin (realized average) | 30–40% |
| Net profit margin (healthy) | 20–30% |
| Net margin (industry average, U.S.) | 14–17% |
| Net margin (best-in-class) | 35%+ |
| Technician labor cost (average) | $15.56/hr (MetricNet) |
| Billing rate floor (L1/L2) | $150/hr |
| Cost per ticket | $15.56–$30+ |
| Technician utilization target | 70–75% billable |
| Annual revenue growth (MSP market) | 8–14% YoY |
The 14–17% average net margin tells you something important: the majority of MSPs are leaving significant money on the table. The difference between 14% and 28% net margin on a $2M revenue book is $280,000 in annual profit. That's not a "raise your rates 5%" problem. Something structural is going wrong.
Gross vs. net: make sure you're measuring the right thing
A lot of confusion in MSP profitability discussions comes from conflating gross and net margin. They measure different things and have different targets.
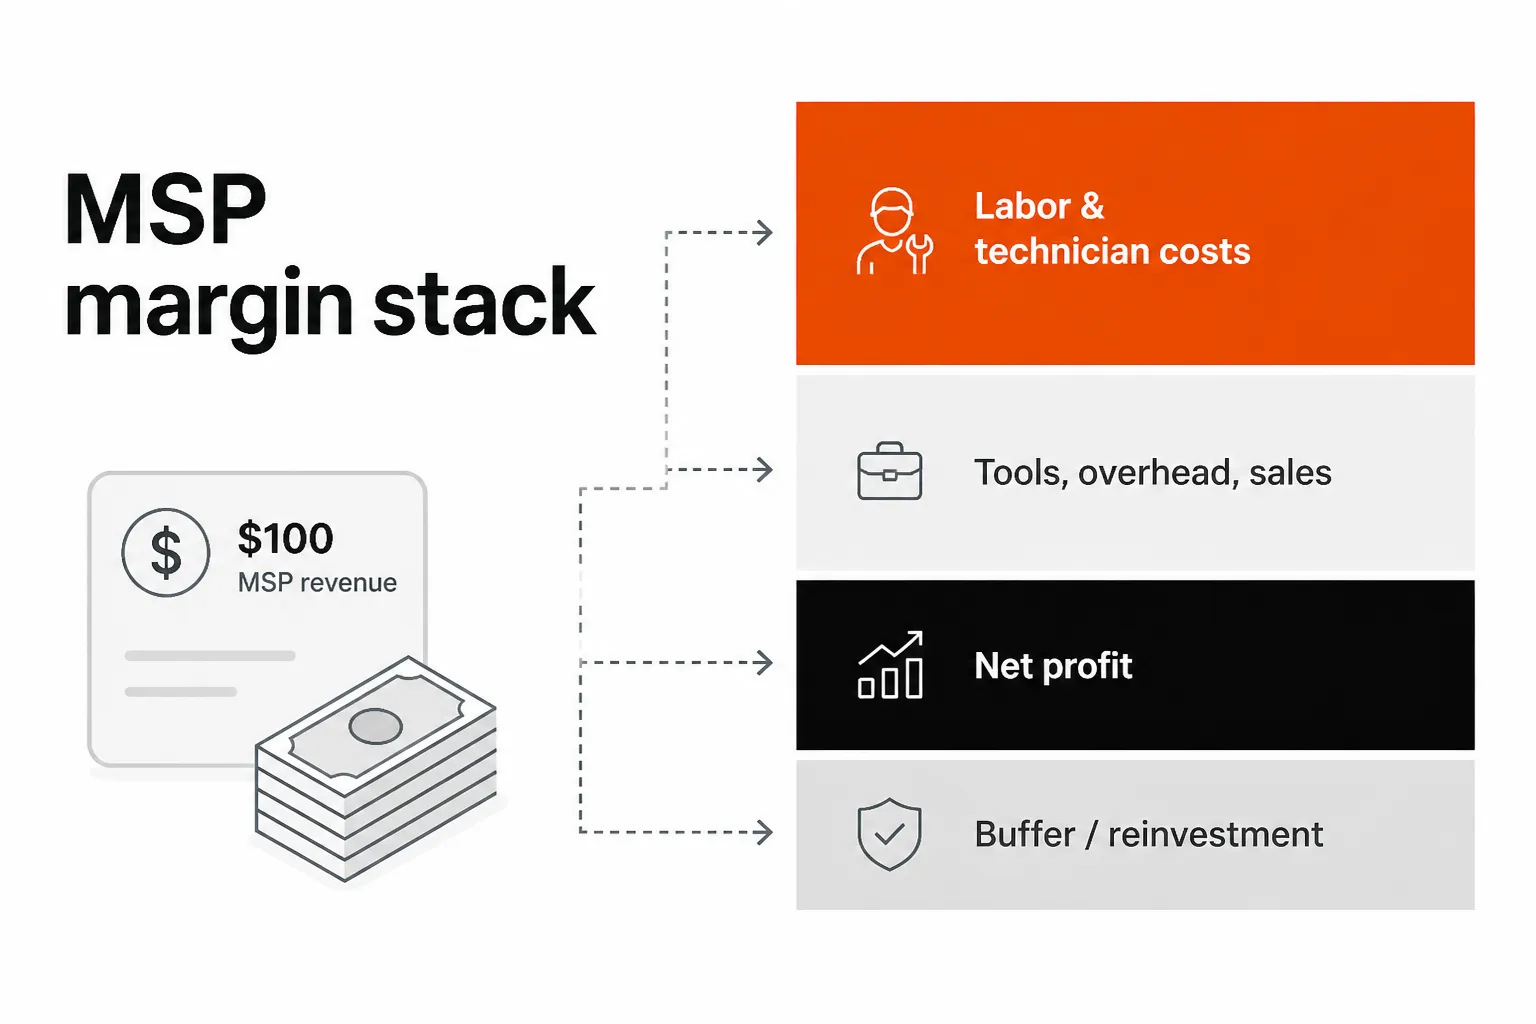
Gross margin is revenue minus direct delivery costs - primarily technician labor and any vendor costs directly tied to the service (software licenses you resell, backup storage, security subscriptions). For managed services, a healthy gross margin is 50–60%. If you're below 40%, the service line itself is poorly structured - either underpriced, or absorbing too much unplanned work.
Net margin is what's left after operating expenses: sales and marketing, your own salary, admin staff, office, tools, training. Healthy net margin is 20–30%. This is what you actually take home as owner profit or reinvest in growth.
The mistake most MSPs make is watching revenue growth while ignoring gross margin. You can grow revenue 20% YoY and actually make less money if your gross margin is shrinking. Adam Hannemann's analysis makes this point sharply: gross margin is the one metric that tells you whether the business model works before overhead enters the picture.
The real margin killers (it's not your pricing)
When an MSP's margins are thin, the instinct is usually to raise rates. Sometimes that's right. But the data from GetFlexpoint's 2026 profitability report and the HAS Team's utilization study point to something more specific.
Underutilized technicians
This is the biggest single margin killer, and most MSP owners underestimate it by a wide margin. The math is brutal:
A 10-person technical team at 60% billable utilization instead of 75% doesn't just lose 15% efficiency. It loses over $135,000 annually in margin. Every percentage point of utilization improvement returns 2–3% in net margin.
Why is utilization so hard to maintain? Because a significant chunk of every technician's day goes to tickets that shouldn't require a human at all. Password resets, account unlocks, MFA resets, software installs, user onboarding - the L1 pile. These tickets typically represent 40–60% of total volume in most MSP environments, and each one costs a real human being 10–20 minutes of attention they can't spend on billable project work, complex escalations, or proactive maintenance.
L1 ticket volume
This is the operational version of the utilization problem. Every password reset your L1 tech handles is:
- $15–$30 in direct labor cost
- Attention pulled from higher-value work
- A billable minute that becomes a cost center
At 400 L1 tickets per month - a completely normal volume for a 500-endpoint MSP - you're burning 100 hours of technician time and $6,000–$12,000 in labor cost on tickets that are, frankly, deterministic. There's no judgment required for a password reset. The answer is always the same. The only variable is which human gets interrupted.
Flat-rate contracts without scope discipline
The third big culprit is poorly scoped all-inclusive contracts. Flat-rate pricing aligns MSP incentives toward efficiency (lower cost to operate = higher margin), which is good. But it only works when scope is locked and enforced. When "all-inclusive" silently expands to cover server migrations, after-hours emergencies, and compliance audits - without a corresponding contract amendment - the gross margin on that client can go deeply negative without the invoice ever changing.
Reddit's r/msp community discusses this constantly: clients expecting unlimited support within fixed packages, and MSPs reluctant to enforce ticket limits because it feels adversarial. The result is a small number of high-maintenance clients quietly destroying the profitability of everyone else.
How pricing model affects margin
The model you choose shapes your margin in structural ways. 63% of MSPs now use per-user pricing as their primary model, but that doesn't make it the best one for profitability.
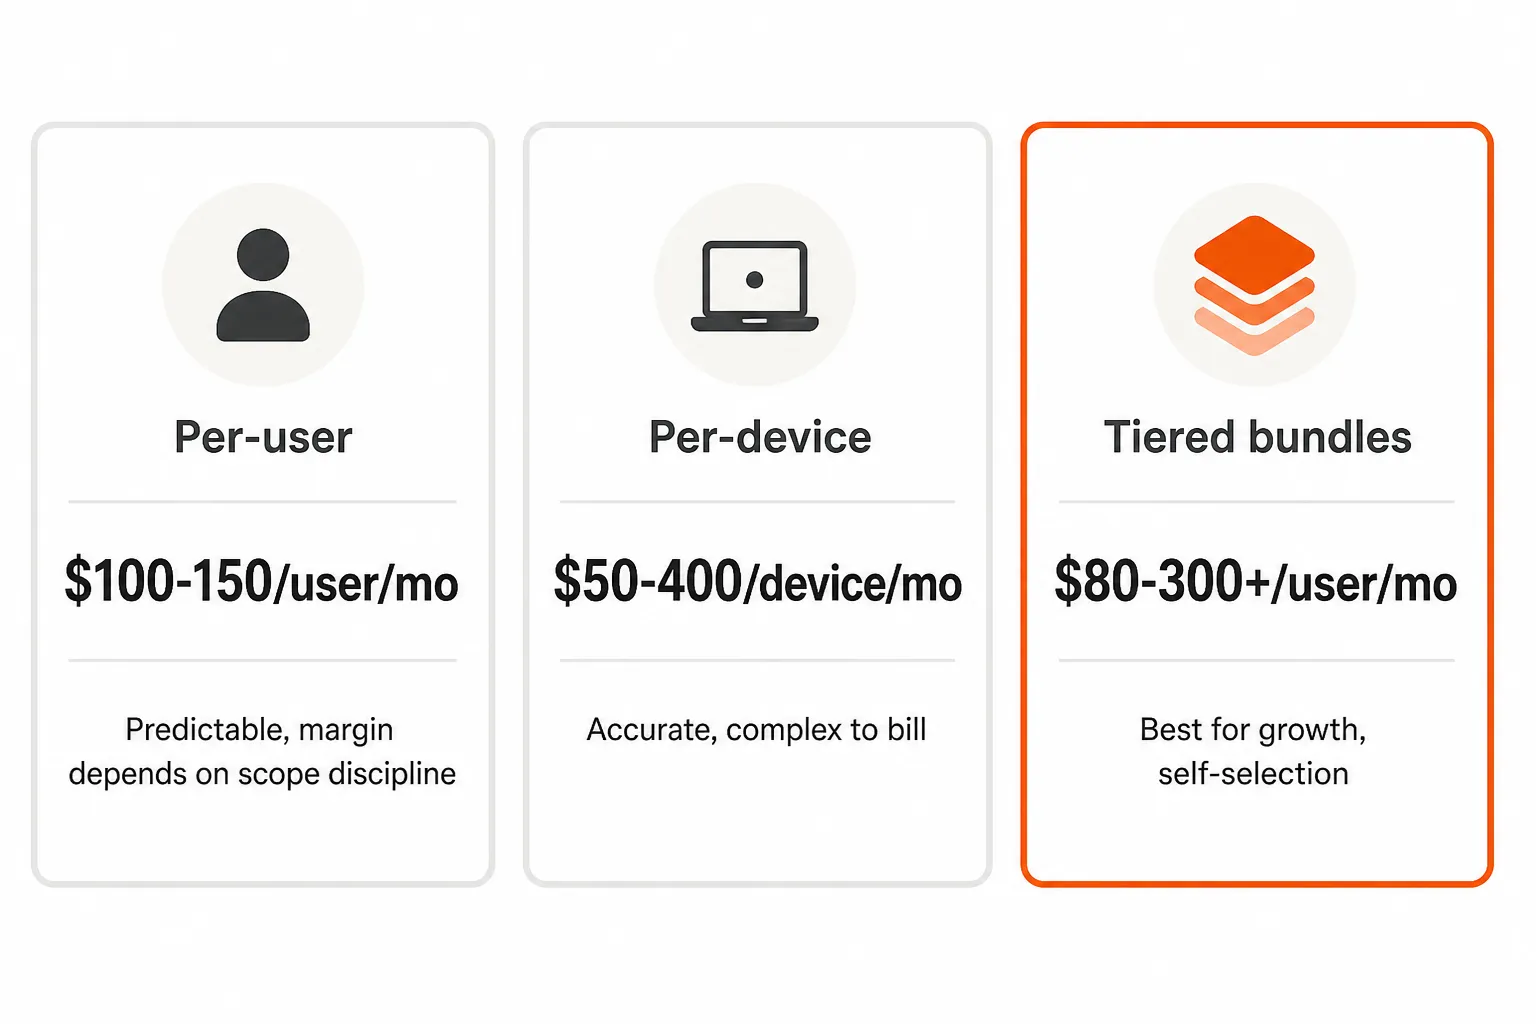
Per-user pricing ($70–$250/user/month) is clean and predictable. The margin risk is scope - two MSPs quoting $150/user can be selling wildly different things. The MSP whose $150/user includes servers, EDR, backup, and after-hours support is operating on a very different cost base than the one billing those separately. If you're using per-user, be ruthlessly explicit about what's in and out. Ambiguity is a margin leak.
Per-device pricing ($50–$400/device/month depending on asset type) reflects actual support burden more accurately, especially in infrastructure-heavy environments. A 50-person company with 75 workstations, 3 servers, and 2 firewalls runs to about $6,475/month on per-device pricing - often higher than per-user for the same environment, which is either more accurate or more friction, depending on how you handle the conversation.
Tiered bundling (Good/Better/Best) is rapidly becoming the default among high-margin MSPs. Tier 1 at $80–$150/user covers basics; Tier 2 at $150–$200/user adds backup, EDR, and email security; Tier 3 at $200–$300+/user adds 24/7 monitoring, compliance reporting, and vCIO. The margin benefit is that clients self-select their risk tolerance rather than forcing you to argue every upsell.
"Tiered pricing has been the biggest change to our margins in five years. Our clients choose their tier, they know exactly what they're getting, and we stop having the conversation about what's included every single time something breaks."
- MSP owner, quoted in r/msp community discussions
Major PSA platforms like ConnectWise, Autotask, and Kaseya now include tiered pricing templates out of the box. That's the market signaling what it expects as default.
What separates 35% net margins from 14%
The Service Leadership Index tracks best-in-class MSPs consistently achieving 19%+ adjusted EBITDA - and many in the 30–35%+ range. What they do differently:
They measure profitability at the client level. Not just total revenue vs. total cost, but specifically which clients are profitable and which aren't. A case study from a mid-market Atlanta MSP illustrates this: 142 clients, $1.8M ARR. After auditing per-client profitability, they identified 57 "zombie clients" earning $1,200/month while costing $1,350/month to serve. Cutting those clients dropped revenue 8% but increased net profit 21%. The rule of thumb they settled on: if annual client revenue is less than 3x (compliance cost + labor cost), the client is a liability.
They vertically specialize. Healthcare and finance clients pay $50–$100/user premium over general small business for compliance and incident response depth. MSPs who've picked a vertical - and genuinely understand its compliance requirements - can charge premiums that commodity shops can't match and can't explain. The pricing isn't arbitrary; it reflects real expertise and risk management.
They've automated L1 tickets. This is the one that's moved fastest in 2026. The math works like this: 50–100 hours/month of L1 work at a fully-burdened cost of $75–$150/hour = $3,750–$15,000 in monthly margin destroyed by deterministic work. Top-margin MSPs have either eliminated this work entirely through AI automation or shifted it to dramatically lower-cost solutions.
The AI automation calculation
This is where the margin math gets interesting in 2026. Traditional AI automation tools (Rewst, Pia, NeoAgent) required $5,000–$50,000 upfront in implementation plus $2,000–$5,000/month in platform fees, with a 6–12 month payback window. The overhead was real: 20–40 hours/month of internal admin after go-live, a forward-deployed engineer during implementation, workflow design and validation before a single ticket gets automated.
The model that's emerged recently breaks that pattern. Tyqra charges $0.50 per ticket - any ticket it touches, whether it resolves, escalates, or triages - with zero base fee and zero implementation cost. For a 500-endpoint MSP handling 400 automatable tickets/month:
| Scenario | Monthly cost | First-year total |
|---|---|---|
| Traditional automation (Rewst/Pia) | $2,000–$5,000 platform | $39,000–$84,000 (incl. implementation) |
| Tyqra | $150–$200 | $1,800–$2,400 |
The 20–45x cost difference before counting implementation overhead is the number that tends to get people's attention. But the margin story isn't just cost - it's speed. Traditional tools hit ROI in 6–12 months. Tyqra connects in one week, recovers 50–100 hours/month of technician time, and the margin math is positive from week one.
Where traditional automation still makes sense: 50+ distinct workflows, deep PSA customization, a dedicated automation admin who can manage the system long-term. For most MSPs under 1,000 endpoints who need L1 tickets handled reliably without a 6-month implementation project, per-ticket AI is a cleaner fit.
How to calculate your actual margin position
Before raising rates or renegotiating contracts, run this calculation:
Step 1 - Fully-burdened technician cost Take each technician's salary. Add 30–45% for payroll taxes, benefits, PTO, training, and equipment. A $90K technician costs $130K–$145K/year, or $65–$72/hour assuming 2,000 billable hours.
Step 2 - Actual billable utilization Track billable vs. total hours for each technician over a 90-day period. If your target is 75% and you're running at 60%, you're wasting 15% of every salary dollar on non-billable time.
Step 3 - Cost per ticket Divide total technician cost by total tickets handled. Or calculate directly: (hourly cost) × (average minutes per ticket / 60). If a technician costing $70/hour handles a ticket in 20 minutes, that ticket costs $23.
Step 4 - Gross margin by service line Calculate revenue and direct cost separately for managed services, project work, and any other lines. Most MSPs are surprised to find that project work is subsidizing managed services, or vice versa.
Step 5 - Per-client profitability Run the same calculation by client. You will almost certainly find that 20–30% of clients are profitable and the rest are marginal or negative. This is the zombie client problem - and it's everywhere.
Once you have these numbers, you know exactly which lever to pull. Usually it's utilization first, then scope discipline, then pricing. Rarely the reverse.
Try Tyqra
Tyqra is an AI technician built specifically for MSPs. It connects to your PSA, RMM, identity stack (Entra ID, Okta, JumpCloud, Google Workspace), and documentation (IT Glue, Hudu), and autonomously resolves L1 tickets - password resets, account unlocks, MFA issues, user onboarding and offboarding, software installs - at $0.50 per ticket with no implementation cost.
The margin math is straightforward: 50–100 hours/month of recovered technician time, zero implementation overhead, positive ROI from week one. For MSPs trying to close the gap between 14% and 25% net margin, L1 automation is the fastest lever available.
14-day free trial, $50 in credit, no card required. See how it works.
Frequently Asked Questions
What is a good profit margin for an MSP in 2026?
A healthy net profit margin for an MSP is 20–30%. Top-performing MSPs with strong automation and vertical specialization can reach 35%+. The average U.S. MSP runs at 14–17% net margin, which means most have significant room to improve - primarily through labor utilization and L1 ticket automation. Thread and SocCash both peg the 20–30% range as the target for well-run shops.
What is a typical gross profit margin for managed services?
A healthy gross profit margin for managed services is 50–60%. This is before operating expenses (sales, marketing, admin). If your gross margin is below 40%, you're likely underpricing, absorbing too much scope creep, or carrying underutilized technician capacity. Break/fix and project work typically run 30–40% gross margin when priced correctly. Adam Hannemann's breakdown is worth reading if you want the full calculation methodology.
What is the biggest reason MSP profit margins are low?
Labor utilization. Not pricing. An MSP with 10 technicians running at 60% billable utilization instead of 75% loses $135,000+ annually in margin - without touching a single contract. The second biggest culprit is underpriced flat-rate contracts with poor scope discipline. Undercutting on recurring fees comes third. Fix utilization first, then pricing.
How do I calculate my MSP's cost per ticket?
Cost per ticket = (fully-burdened hourly labor cost) × (average time per ticket in hours). A technician earning $90K/year fully burdened (benefits, payroll taxes, PTO, training) costs roughly $130K–$145K annually, or about $65–$72/hour. If the average L1 ticket takes 15 minutes, your cost per ticket is $16–$18. If it takes 30 minutes for L2 work, you're looking at $32–$36. Most MSPs don't measure this at the ticket level, which is exactly why margins leak.
Can AI automation actually improve MSP profit margins?
Yes, and it's the fastest lever available in 2026. L1 tickets - password resets, account unlocks, MFA issues, software installs - typically represent 40–60% of ticket volume and cost $15–$30 each in technician time. AI technicians like Tyqra handle these at $0.50/ticket with zero implementation overhead. A 500-endpoint MSP handling 400 automatable tickets/month saves $6,000–$12,000 in monthly labor cost for roughly $200/month in AI cost - an effective 30–60x ROI in recovered margin.